Tools
[Home] - [User Interface] - [Observations] - [Forecast Models] - [Static Layers] - [Events]
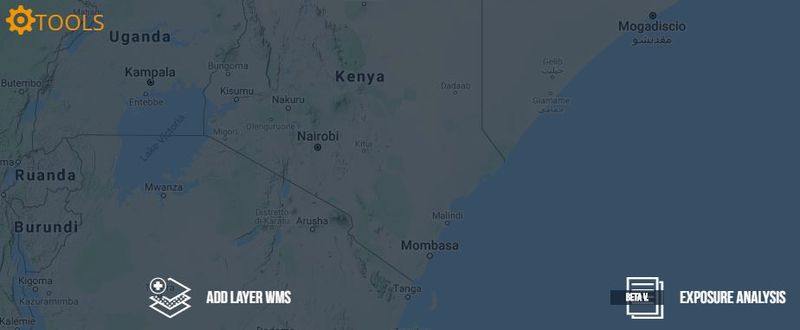
The fifth action button of the Toolbar is the Tools menu, which provides the users with some useful functions that are available within the platform. Once the user clicks on the menu, the available tools shown as listed below:
Add a WMS
This function allows the users to add to the list of the available layers any data (raster, vector, geotiff) that can be provided through a WMS.
Once the user has selected the function, the following form is displayed:
The user has to copy the url of WMS server they would like to visualize in the text box and then press Load Data ID.
If the service is freely available (no usr/pwd needed to enter), the system will prompt a list of all the layers available on that server.
Then, to visualize the chosen WMS layer, the user has to click on it and then press Add WMS layer: the data will automatically appear on the control map
Exposure Analysis
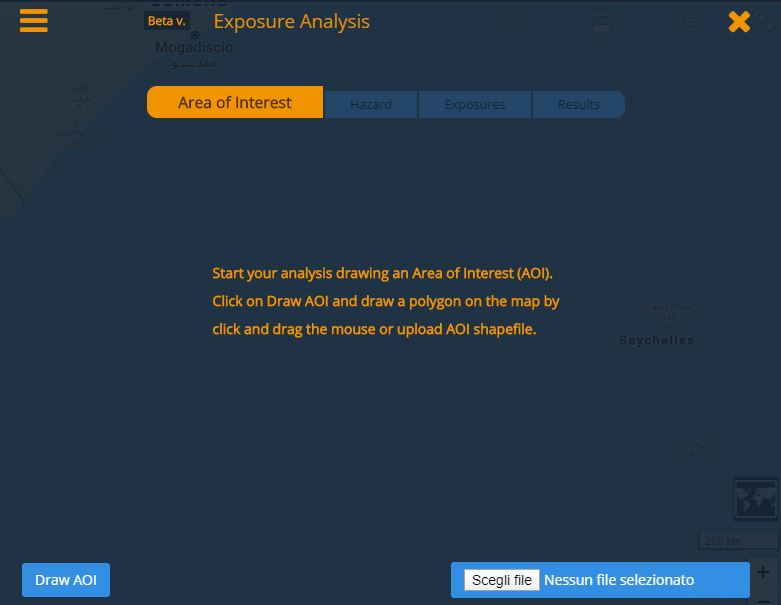
A comprehensive risk scenario can be designed by the user through the Exposure Analysis dashboard (see the figure below)
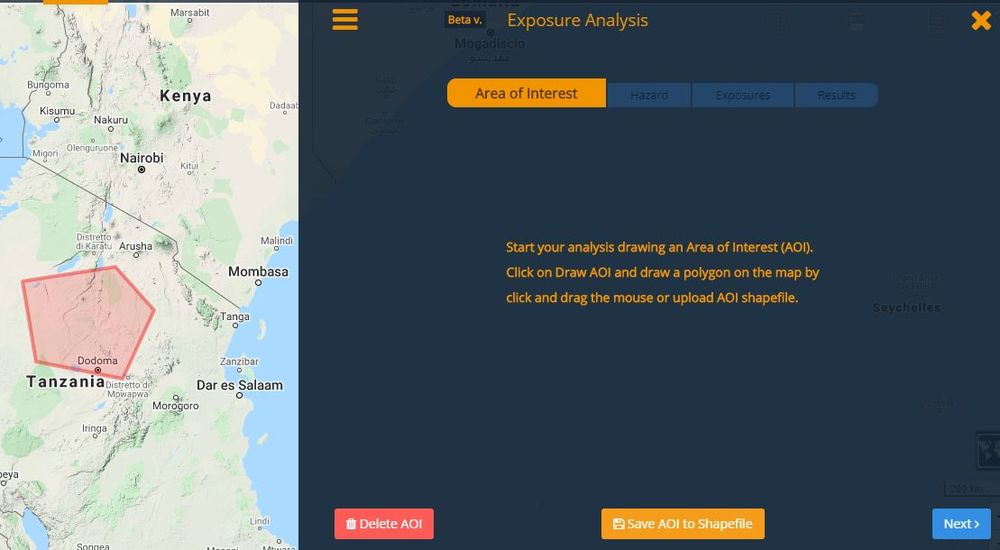
The first step consists in drawing an Area of Interest (AOI) to carry out the exposure analysis. To do that, after pressing the Draw an AOI button the user has to left click on the map to set the initial point of the polygon: to complete the AOI, the last point and the initial one must coincide (i.e., the user has to click again on the initial point).
Alternatively, an AOI might be uploaded directly to the platform by the user, provided it is a shapefile: in this case, the full set of file in .zip format has to be uploaded after clicking on Select a file.
In order to compose a risk scenario, exposure layers have to be selected. To do that, click on the Select layers button.
At present, these layers of the exposures are available:
- GHS-Population (2015)
- World Population (GPV v4 - 2015)
- Health facilities
- Global Roads Network
- Global Railroads Network
- Dams
- Power Plants
- Airports
The user is allowed to pick without restrictions as many layers as desired by means of the Add other layers button.
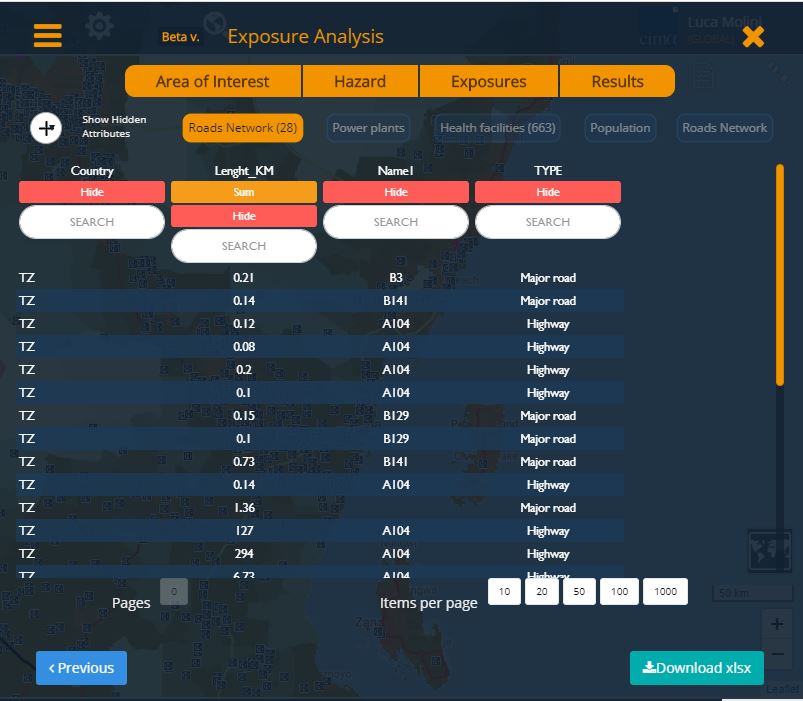
Once the selections have been made, the user can visualize the results of the exposures laying within the AOI by clicking on the GO button:
a list of the available features for each exposure will be prompted as in the figure below.
The results might be download in .xlsx format by clicking on the button Download .xlsx.
If the user is not satisfied with the results, the scenario can be modified by clicking on Add other layers and
- selecting more/different data or by clicking on Draw a new AOI
- or starting over with a new polygon (in this case, remember to click on Clear the AOI before drawing a new one).
[Home] - [User Interface] - [Observations] - [Forecast Models] - [Static Layers] - [Events]


