PM2.5(eng)
[User Guide | [Home]]] - [Forecast Models]
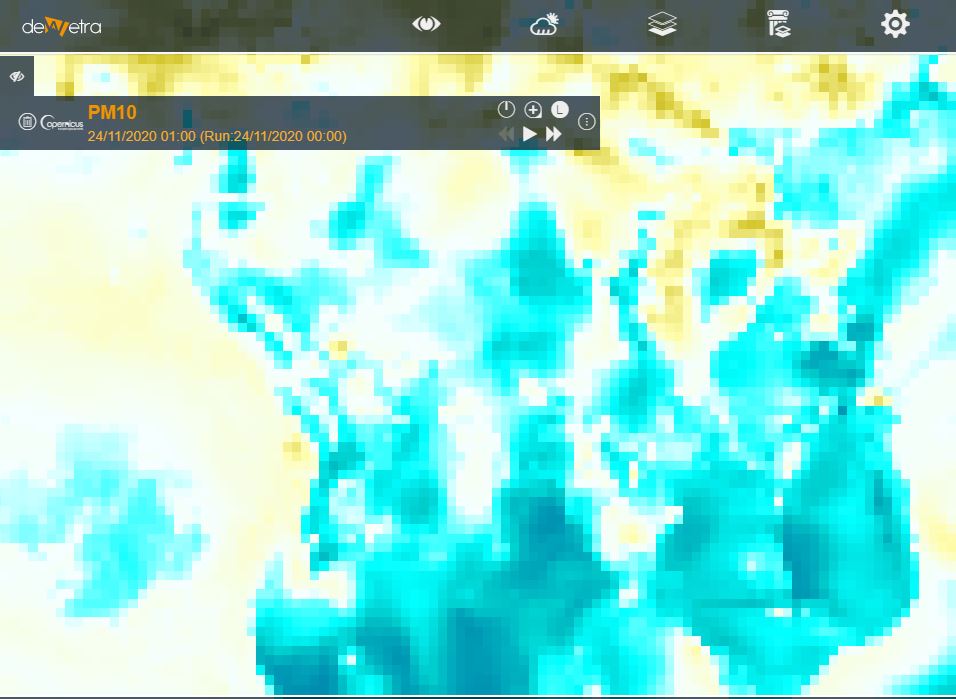
| Layer name | PM10 | ||
| Tag | Air quality | ||
| Folder | |||
| Source | CAMS | ||
| Description | The global forecasting system of the Copernicus Atmosphere Monitoring Service (CAMS) was successfully upgraded yesterday, 6 October. The CAMS forecasts are produced by the latest version of ECMWF’s highly successful Integrated Forecasting System (IFS), which is also used for the operational weather forecasts.
This upgrade combines four significant scientific changes which will make the CAMS global forecasts even more accurate and robust: The anthropogenic emissions have been updated to a newer version. In addition, the diurnal cycle and vertical injection height of the emissions for some pollutants, such as SO2, have been refined. The parametrisations that model the emission of sea salt and desert dust have been updated resulting in better agreement with measured sea salt aerosol concentrations and reducing an overestimation of dust in the Sahara, the Middle East and other regions. The modelling of stratospheric ozone has been updated with an improved hybrid linear ozone scheme, which improves the vertical profile of stratospheric ozone in the forecasts. The assimilation of volcanic SO2 observations from the Sentinel-5p/TROPOMI instrument has been activated. The new improved global forecasting system was already started in October 2019 and ran in test mode until it became the operational system, yesterday. The CAMS validation team, led by the Dutch Weather Service (KNMI), carefully assessed the outputs to ensure the quality of the daily analyses and forecasts. Their report was published late September and formed the basis for the final decision to go ahead with the implementation of this improved version for the benefit of all users. The main findings of the extensive report are summarized in the table below, which identifies aspects of the forecast where there is an improvement, aspects that remain the same, and aspects that show some degradation. The assessment was made for the period October 2019 until May 2020 and uses independent observations as a reference. Only variables for which sufficient independent observations were available are shown and the assessment is based on statistical measures, such as systematic error, random error, and correlation. The routine comparison of the CAMS global forecasts with independent observations can be found on the Global Evaluation Server. More info at: documentation on line | ||
| Screenshot | |||
| Properties | |||
| Available variables | PM10 denisty in micrograms per cubic metre | ||
| Available accumulations | |||
| Available interpolation algorithms | |||
| Available filters | |||
| Spatial aggregations |

