GLOFAS Seasonal Outlook Reporting Points (eng)
| Layer name | GLOFAS Alert Probability | |
| Tag | Hydrological Models | |
| Folder | ||
| Source | Global Flood Awareness System | |
| Description | The seasonal forecast products are updated once per month and made available via the forecast viewer on the 10th of each month.
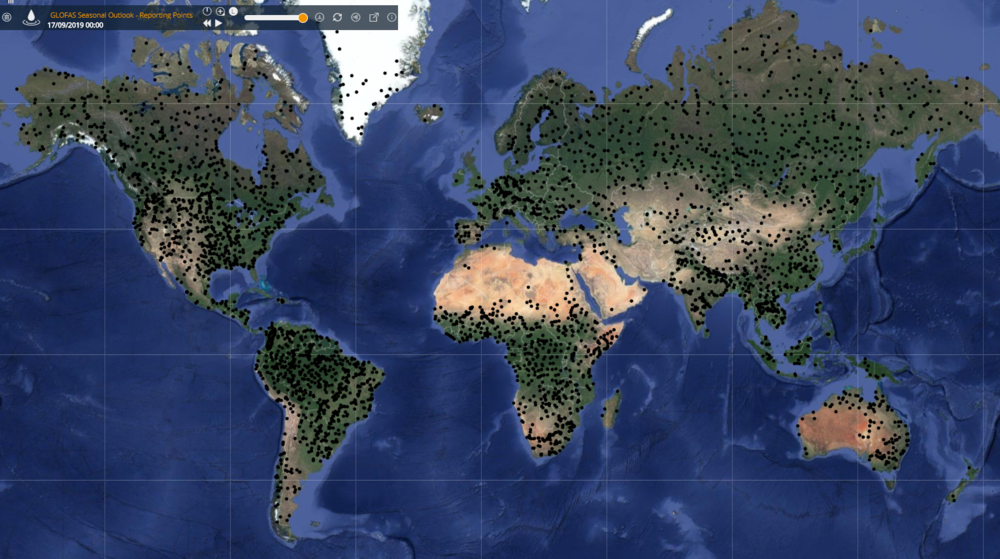
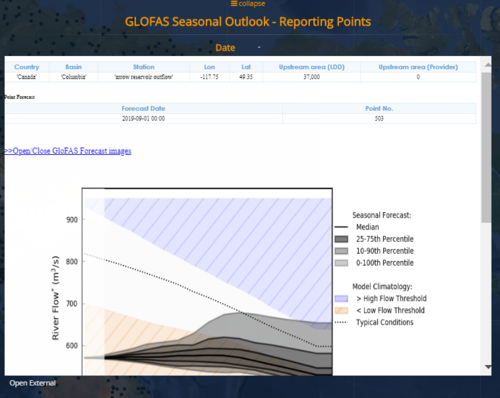
The seasonal outlook is produced by forcing the Lisflood river routing model with surface and sub-surface runoff from SEAS5, the latest version of ECMWF’s seasonal forecasting system, which consists of 51 ensemble members at ~35km horizontal resolution. This produces a probabilistic forecast of river flow at 0.1o horizontal resolution (~10km, the resolution of Lisflood) out to four months. The river flow forecasts are initialized using the latest ERA-5 model reanalysis, and the reference climatology used to determine the thresholds of high and low river flow is the 18-year GloFAS-Seasonal reforecast dataset. River flow observations are not currently used in the system. All GloFAS seasonal outlook products are based on weekly-averaged (using calendar weeks; Monday to Sunday) river flow. As the seasonal forecast products are made available on the 10th of each month, the map layers do not include the first two weeks of the forecast in order to reflect this. The third GloFAS-Seasonal layer provides reporting points (both dynamic and permanent) with global coverage, where additional forecast information is available. Ensemble hydrographs (see Figure) are provided at each reporting point, displaying the probabilistic forecast (grey shading) of weekly-averaged river flow out to 4 months, alongside key thresholds calculated from the model climatology. These graphs are available by clicking the points. The first 10 days of the forecast are faded to reflect the release date of the seasonal forecast products on the 10th of each month. Blue shading indicates the 80th percentile of the model climatology and above; orange the 20th percentile and below. Typical conditions (median of model climatology) are indicated by the dotted line. These thresholds allow comparison of the forecast with typical conditions and extreme conditions for the given location and for the time of year.
| |
| Screenshot | ||
| Properties | ||
| Available variables | Seasonal Outlook reporting points graphs | |
| Available accumulations | ||
| Available interpolation algorithms | ||
| Available filters | ||
| Spatial aggregations |

