Difference between revisions of "Phisical exposition to flood(eng)"
From MyDewetra World
(Created page with " [Home] - [Static Layers] {| class="wikitable" |- |style="background-color: orange;" |Layer name |style="background-color: orange;"|Physi...") |
(No difference)
|
Latest revision as of 22:18, 17 November 2018
| Layer name | Physical exposition to flood | |
| Tag | Risk | |
| Folder | ||
| Source | UNEP | |
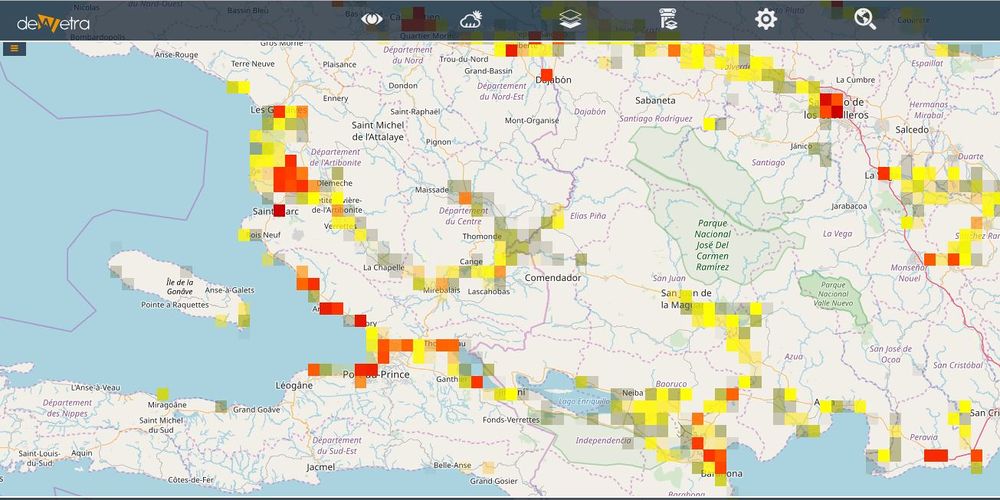
| Description | This dataset includes an estimate of the annual physical exposition to flood. It is based on three sources: 1) A GIS modeling using a statistical estimation of peak-flow magnitude and a hydrological model using HydroSHEDS dataset and the Manning equation to estimate river stage for the calculated discharge value. 2) Observed flood from 1999 to 2007, obtained from the Dartmouth Flood Observatory (DFO). 3) The frequency was set using the frequency from UNEP/GRID-Europe PREVIEW flood dataset. In area where no information was available, it was set to 50 years returning period. 4) A population grid for the year 2010, provided by LandScanTM Global Population Database (Oak Ridge, TN: Oak Ridge National Laboratory). Unit is expected average annual population (2007 as the year of reference) exposed (inhabitants) . This product was designed by UNEP/GRID-Europe for the Global Assessment Report on Risk Reduction (GAR). It was modeled using global data. Credit: GIS processing UNEP/GRID-Europe, with key support from USGS EROS Data Center, Dartmouth Flood Observatory 2008. More info at: Global Risk Data Platform webpage | |
| Screenshot |

