Difference between revisions of "SPI-IRI(eng)"
From MyDewetra World
| Line 26: | Line 26: | ||
|Screenshot | |Screenshot | ||
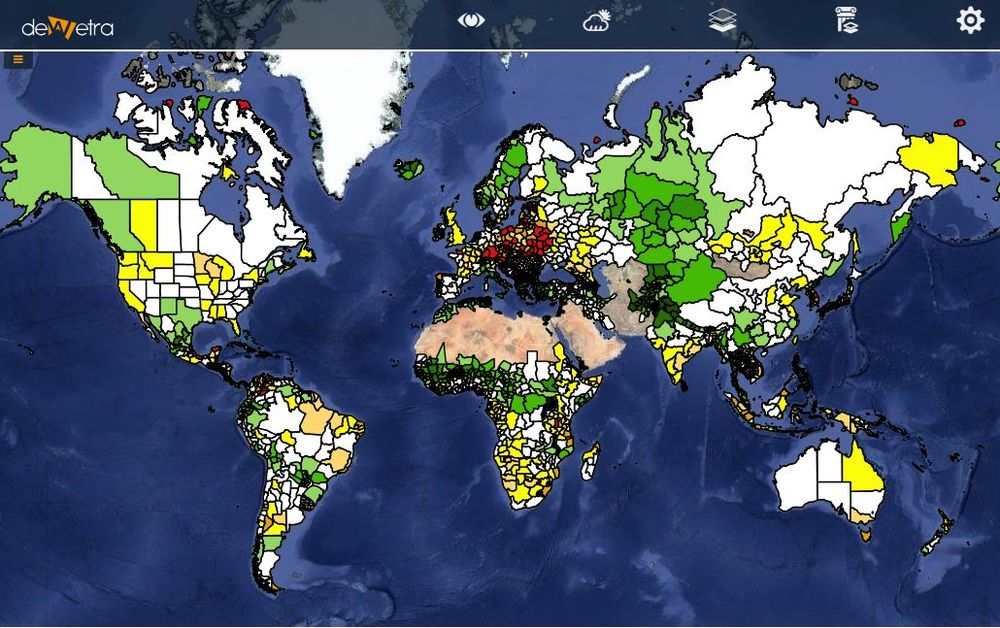
|[[File:all_spi.JPG|1000px|thumb|centre|]] | |[[File:all_spi.JPG|1000px|thumb|centre|]] | ||
| − | |[[File: | + | |[[File:spei.PNG|800px|thumb|centre|Legend]] |
|- | |- | ||
|style="background-color: grey;"| Properties | |style="background-color: grey;"| Properties | ||
Revision as of 08:56, 17 September 2019
| Layer name | Standardized Precipitation Index | |
| Tag | Drought | |
| Folder | ||
| Source | University of Columbia - International Institute for Research on Climate and Society | |
| Description | The Standardized Precipitation Index (SPI; McKee et al. 1993) is the number of standard deviations that observed cumulative precipitation deviates from the climatological average. The index is based entirely on monthly precipitation accumuluations and its values can be compared across different climatic and geographic regions. These characteristics of the SPI have contributed to its popularity for application towards drought and water resource monitoring.
Studies have suggested that a minimum of 50 years of precipitation data be used to calculate SPI values. It should therefore be noted that the UEA New and TS2.1 datasets are the only precipitation datasets in the current set of analyses that meet that recommendation. Extreme SPI values in the other three datasets (CAMS OPI, CMAP, GPCP) may be suspect as they are based on roughly half of the recommended amount of data. More info at: SPI-IRI documentation on line | |
| Screenshot | File:Spei.PNG Legend | |
| Properties | ||
| Available variables | Standardized Precipitation Index | |
| Available accumulations | Averaged on 3, 6, 9 and 12 months | |
| Available interpolation algorithms | ||
| Available filters | ||
| Spatial aggregations |
