Difference between revisions of "GLOFAS Reporting Points (eng)"
From MyDewetra World
(Created page with " [Home] - [Forecast Models] {| class="wikitable" |- |style="background-color: orange;" |Layer name |style="background-color: orange;"|G...") |
|||
| Line 33: | Line 33: | ||
|- | |- | ||
|Available variables | |Available variables | ||
| − | | | + | |Reporting points graphs |
|- | |- | ||
|Available accumulations | |Available accumulations | ||
Latest revision as of 10:16, 17 September 2019
| Layer name | GLOFAS Reporting Points | |
| Tag | Hydrological Models | |
| Folder | ||
| Source | Global Flood Awareness System | |
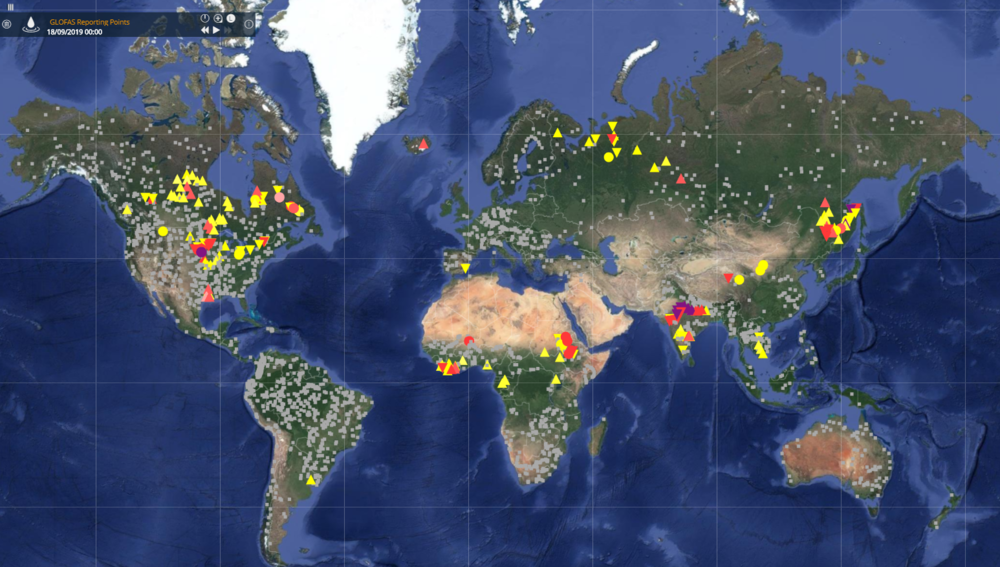
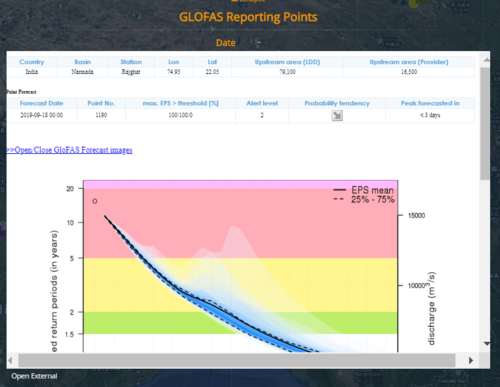
| Description | This data set contains key locations at which the GloFAS flood forecast shows a high probability of exceeding the 2-, 5- and 20-year return period (three separate layers). Additionally, information for a large number of fixed stations all over the world is provided. For all stations, a wide-range of additional hydrological information is provided, such as:
- hydrograph showing the probabilistic forecast for the next 30 days based on ECMWF-ENS - calendar matrices showing the evolution of forecasts in relation to the exceedance of critical hydrological thresholds. The update frequency of this data set is daily, and the spatial coverage is global; while the horizontal resolution is 0.1 degree. This information is produced by the operational suite of GloFAS (www.globalfloods.eu) in order to provide the user with in-depth information at relevant key locations. This information also provides a good indication of the reliability of the hydrological forecast. More info at:GLOFAS Reporting Points | |
| Screenshot | ||
| Properties | ||
| Available variables | Reporting points graphs | |
| Available accumulations | ||
| Available interpolation algorithms | ||
| Available filters | ||
| Spatial aggregations |

